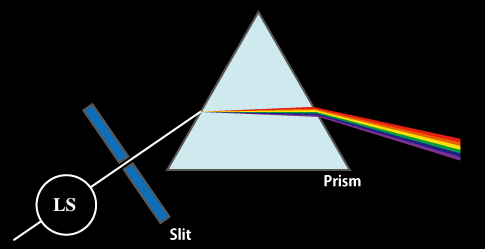
After it rains, a rainbow sometimes appears in the sky. This is due to refraction of light by water droplets, and the diffraction angle depends on the wavelength of the incident light. A similar effect can be produced by a prism, which was used to produce the first spectrograph (Figure 1).
Electronic transitions due to light absorption
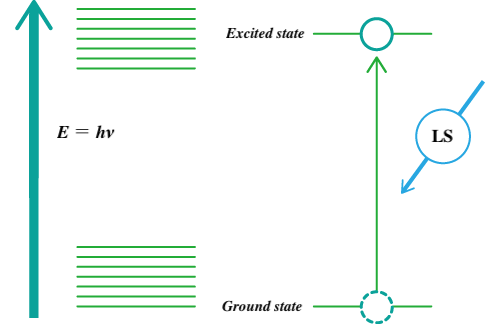
Electrons in atoms and molecules absorb light energy and change from the ground state to an excited state. Such electronic transitions occur at discrete energy levels (Figure 2) that are specific to the atoms or molecules involved.
Figure 2 Energy levels and light absorption
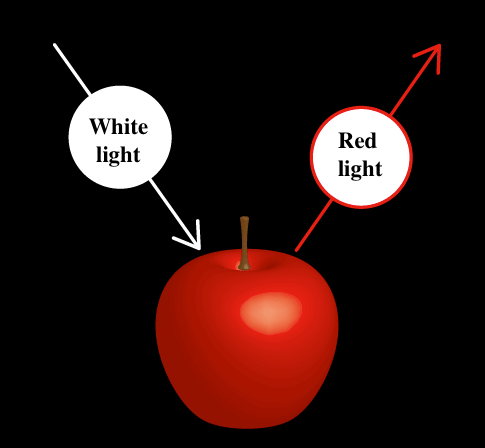
Figure 3 Material color determined by visible light absorption, reflection and scattering
Visible light and material color
Different substances absorb light at different wavelengths. For example, red apples absorb light in the wavelength range of about 400 – 600 nm. On the other hand, light with wavelengths of 600 to 700 nm (red) is not absorbed but is reflected and scattered, so that our eyes perceive apples as red (Figure 3).
Absorption spectrophotometer
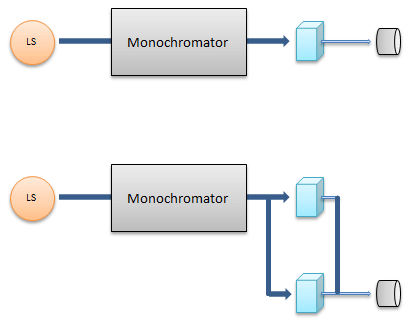
A UV-Vis spectrophotometer comprises a light source, a monochromator, a sample cuvette (cell), and a photodetector. There are two types of optical arrangement: single beam and double beam (Figure 4). In either case, white light from a light source (LS) is introduced into a monochromator and dispersed by a diffraction grating.
Only light with a specific wavelength is extracted from the resulting spectrum through the exit slit. In the case of a single beam, the obtained monochromatic light with intensity I0 irradiates a sample and the transmitted light with intensity I is detected. Here, I/I0 is the transmittance. In the double-beam configuration, the monochromatic light is divided into two by a beam splitter, and the individual beams pass through a sample and a reference, following which both are detected. By bifurcating the optical path, both I0 and I can be measured simultaneously.
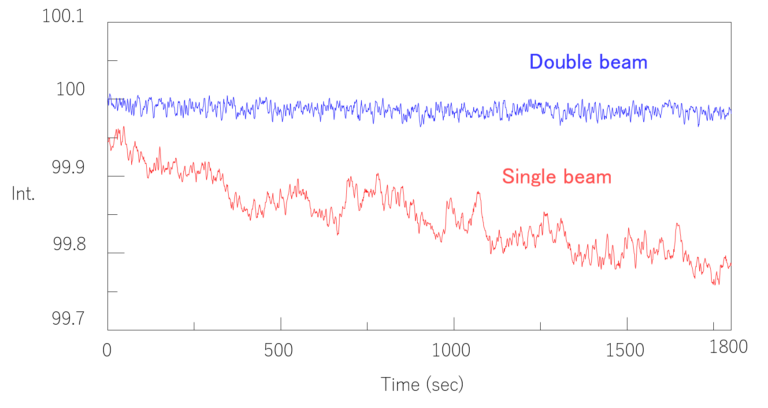
Figure 5 Comparison of baseline variations for single-beam and double-beam measurements
Single beam and double beam
In the single-beam configuration, the monochromator, sample, and detector are arranged in series. Although the optical system is simple, it is easily affected by fluctuations in the light source, and a blank measurement is required every time. In the-double beam configuration, monochromatic light is split into two beams by a beam splitter, and the sample and reference are irradiated. Blank correction can therefore be performed automatically and there is no effect of light source fluctuations (Figure 5).
We and selected third parties use cookies or similar technologies for technical purposes and, with your consent, for other purposes as specified in the Privacy Policy and Cookie Policy. You can freely give, deny, or withdraw your consent at any time by clicking "Manage Consent" at the bottom of the page. You can consent to the use of such technologies by using the “Accept All” button or deny and close the notice by using the "Reject All" button. Settings
This website uses cookies to improve your experience while browsing the website. Of these, cookies that are categorized as necessary are stored in your browser as they are essential for the basic functionality of the website to work. We also use third party cookies that help us analyze and understand how you use this website. These cookies will be stored in your browser only with your consent. You also have the option to disable these cookies. However, disabling some of these cookies may affect your browsing experience.
Necessary cookies are absolutely essential for the website to function properly. These cookies ensure basic functionalities and security features of the website, anonymously.
Cookie
Duration
Description
cookielawinfo-checbox-analytics
11 months
This cookie is set by GDPR Cookie Consent plugin. The cookie is used to store the user consent for the cookies in the category "Analytics".
cookielawinfo-checkbox-necessary
11 months
This cookie is set by GDPR Cookie Consent plugin. The cookies is used to store the user consent for the cookies in the category "Necessary".
CookieLawInfoConsent
1 year
Records the default button state of the corresponding category & the status of CCPA. It works only in coordination with the primary cookie.
elementor
never
This cookie is used by the website's WordPress theme. It allows the website owner to implement or change the website's content in real-time.
viewed_cookie_policy
11 months
The cookie is set by the GDPR Cookie Consent plugin and is used to store whether or not user has consented to the use of cookies. It does not store any personal data.
Analytical cookies are used to understand how visitors interact with the website. These cookies help provide information on metrics the number of visitors, bounce rate, traffic source, etc.
Cookie
Duration
Description
Google Maps
Google Maps is a map visualization service managed by Google Inc. and is used to integrate such contents within its pages.