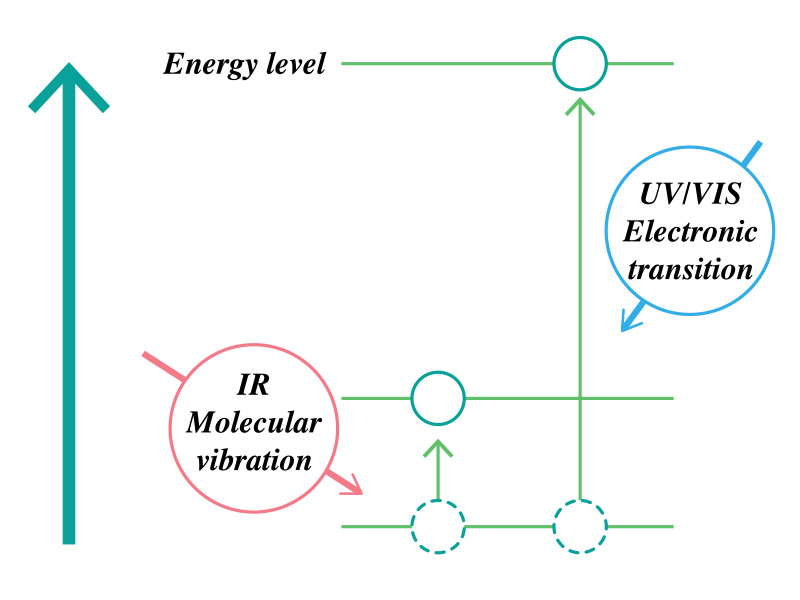
In infrared spectroscopy, a sample is irradiated with infrared light, and the transmitted or reflected light is measured, allowing structural analysis and quantification. Absorbance analysis involves measuring the amount of absorption of light by the molecules in a sample, which is wavelength dependent. In the case of ultraviolet and visible light (0.2 to 0.78 μm), absorption occurs due to electronic transitions in molecules. In contrast, infrared light (2.5 to 25 μm) is absorbed due to vibration and rotation of molecules, and the energy involved is smaller (Figure 1).
In a molecule, interatomic chemical bonds can stretch as if they were springs. The energy associated with such stretching vibrations is close to that of infrared light, so that molecules absorb infrared light and vibrate. The vibrations that can be induced by infrared light are limited to those involving a change in dipole moment. Infrared absorption does not occur if the vibrations of bonds between atoms cancel each other.
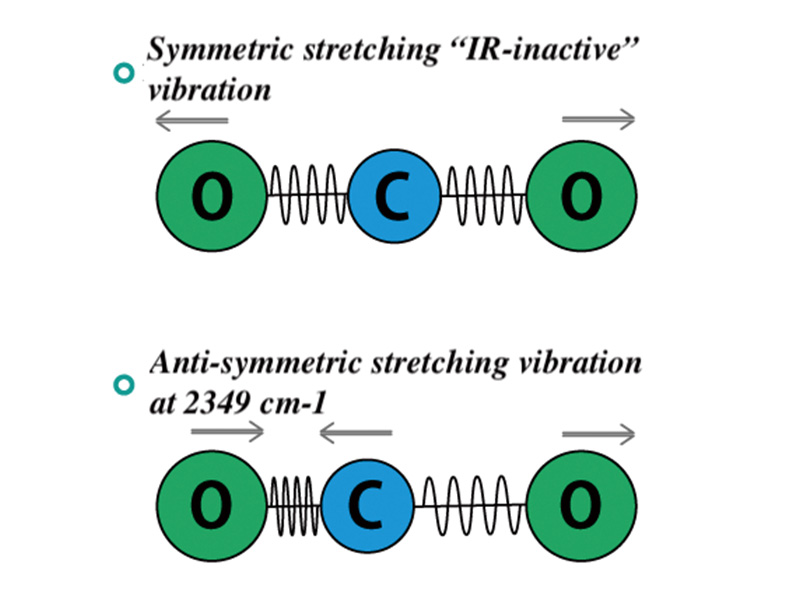
In the case of a linear molecule such as CO2, symmetric stretching vibrations do not absorb infrared light because the dipole moment does not change, but asymmetric stretching vibrations do absorb infrared light because the dipole moment changes. Atmospheric warming occurs because CO2 absorbs infrared light in this manner, and so acts as a greenhouse gas.
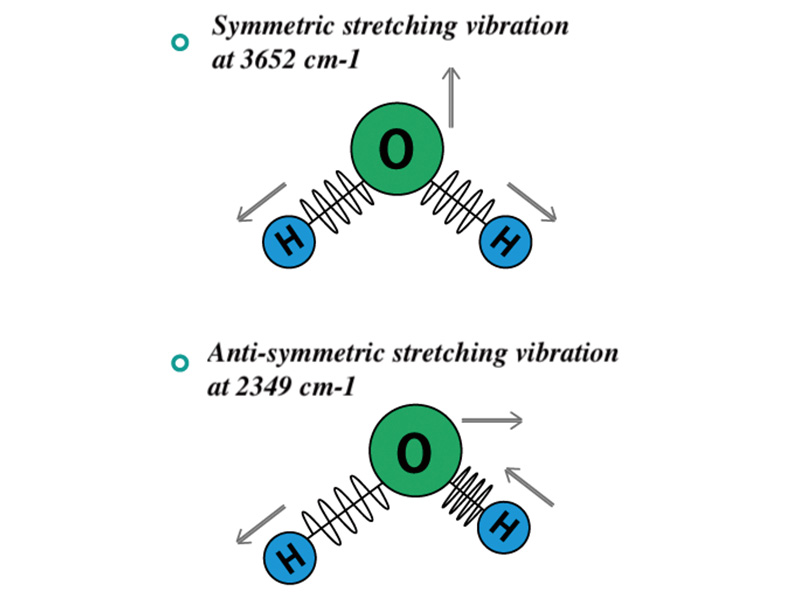
In the case of H2O, which is a nonlinear molecule, both symmetric and asymmetric stretching vibrations absorb infrared light because the dipole moment changes. The absorption band due to symmetrical stretching appears at 3,652 cm-1, and that due to asymmetric stretching appears at 3,756 cm-1.
In addition to stretching vibrations, infrared absorption also occurs for bending and rotational vibrations, as long as the dipole moment changes.
In an infrared spectrum, absorption peaks associated with functional groups such as -OH and -COOH appear at specific wavenumbers. These regions are referred to as characteristic absorption bands, and the peaks can be analyzed in order to estimate the structure of the compound. The IR spectrum contains information unique to a particular substance, and can be compared with the spectrum of a standard sample stored in a database in order to identify an unknown sample. Hundreds of thousands of standard IR spectra are currently available. These libraries mainly contain information on organic substances, and are used in a wide range of fields such as medicine, agriculture, biology, gas analysis and forensics.
A Fourier transform is a method for separating overlapping waveforms with different frequencies.
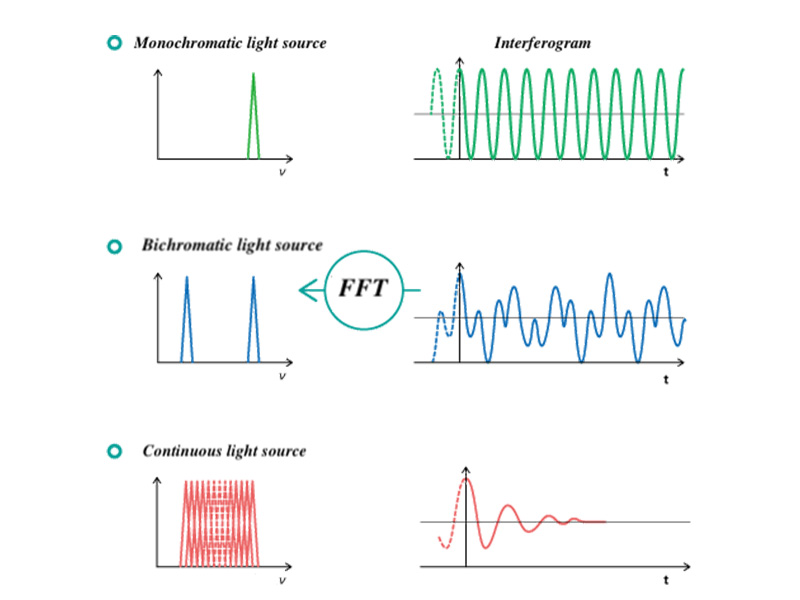
In FTIR spectroscopy, an interference wave is synthesized from two beams separated by a beam splitter, the detected interference waveform (interferogram) is Fourier-transformed, and a spectrum is obtained by separating each wavenumber. Figure 3 shows an overview of the conversion of an interferogram for bichromatic light into an IR spectrum.
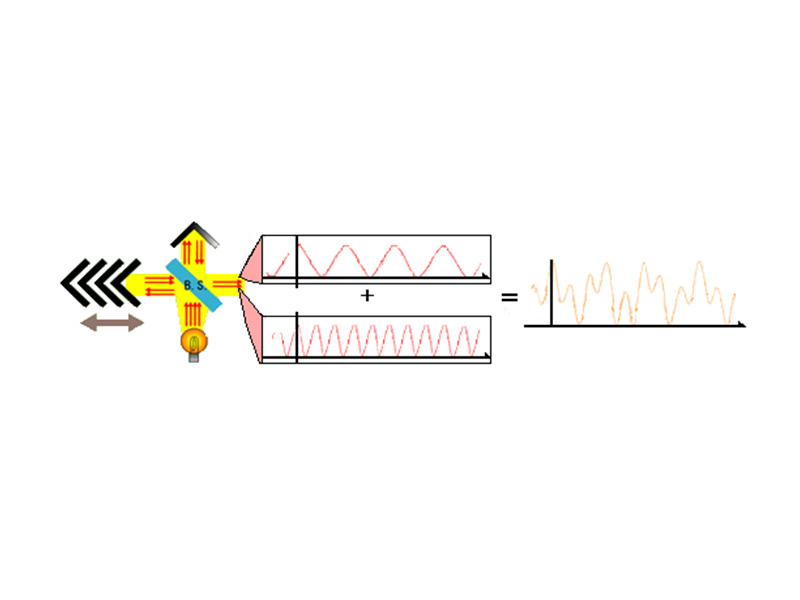
Monochromatic light is a superposition of waves of the same frequency. The light intensity is a maximum when all of the individual waves have the same phase, and decreases as the phase difference becomes larger. In a FTIR spectrophotometer, this phase difference is varied using a mirror that moves at a constant speed, together with a dual light path. For a monochromatic light source, a plot of the detected light intensity against time (mirror movement distance) appears as a sinusoidal wave, as seen in the upper row of Figure 4. Taking a Fourier transform of this waveform produces a single peak at the frequency of the monochromatic light.
In the case of bichromatic light, containing components with two different frequencies, a more complicated waveform is produced. When this is subjected to a Fourier transform, it produces two peaks corresponding to the two frequencies present, as seen in the middle row in Figure 4.
For a continuous light source, its spectrum corresponds to a superposition of waves of different frequencies, all in phase with each other. Before the mirror is moved (when the time t = 0), there is no phase difference between the optical paths, and the light intensity at all wavenumbers is highest. However, as time passes (the mirror moves), destructive interference occurs and the signal strength gradually converges to zero. The resulting plot of signal intensity against time is referred to as an interferogram. By taking a Fourier transform of the interferogram, the original frequency spectrum can be calculated, as shown in the lower row in Figure 4.
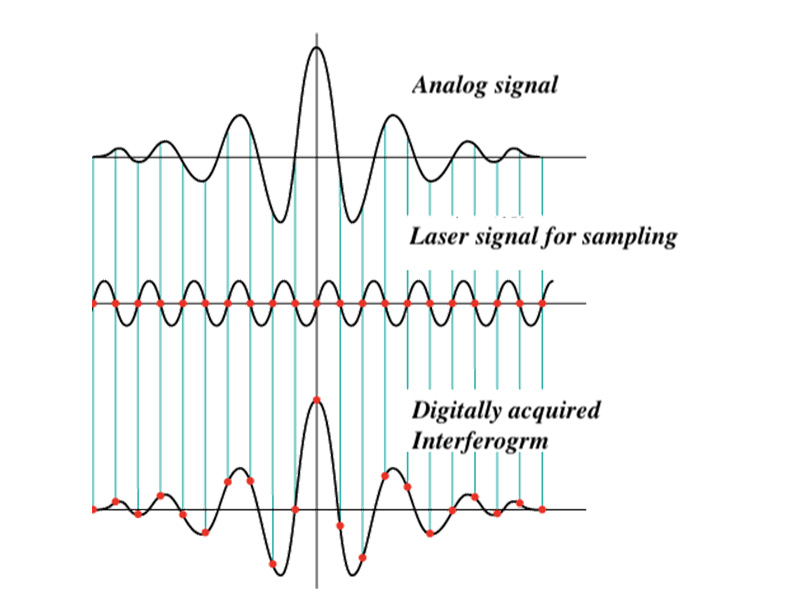
FTIR detectors observe interferograms as analog signals, but in order to perform a Fourier transform, a digital signal is needed. In a FTIR spectrophotometer, monochromatic light from laser is used, together with a moving mirror, and the intensity of the output interference signal is measured as a function of time. A laser can grant a very stable monochromatic light source, and so it can accurately obtain an interferogram at equal intervals, which can be used to produce a spectrum with high wavenumber accuracy, as shown in Figure 5.
©Jasco Europe S.R.L. (Socio Unico) Direzione e coordinamento ex. art. 2497 bis c.c. – P.I. 08609570158 | Privacy Policy | Cookie Policy | Manage consent | Realizzazione sito web: Alkimedia
| Cookie | Duration | Description |
|---|---|---|
| cookielawinfo-checbox-analytics | 11 months | This cookie is set by GDPR Cookie Consent plugin. The cookie is used to store the user consent for the cookies in the category "Analytics". |
| cookielawinfo-checkbox-necessary | 11 months | This cookie is set by GDPR Cookie Consent plugin. The cookies is used to store the user consent for the cookies in the category "Necessary". |
| CookieLawInfoConsent | 1 year | Records the default button state of the corresponding category & the status of CCPA. It works only in coordination with the primary cookie. |
| elementor | never | This cookie is used by the website's WordPress theme. It allows the website owner to implement or change the website's content in real-time. |
| viewed_cookie_policy | 11 months | The cookie is set by the GDPR Cookie Consent plugin and is used to store whether or not user has consented to the use of cookies. It does not store any personal data. |
| Cookie | Duration | Description |
|---|---|---|
| Google Maps | Google Maps is a map visualization service managed by Google Inc. and is used to integrate such contents within its pages. |