Microspectroscopy is a general term for techniques that utilize a combination of optical microscopy and molecular spectroscopy. Homogeneous samples can be simply analyzed by absorption spectroscopy, for example ultraviolet-visible spectroscopy.
However, in the case of complex heterogeneous systems such as cells and biological tissues, it is necessary to combine spectroscopic methods in addition to performing microscopic observations of particular regions.
Microspectroscopy has dramatically expanded the possibilities for analysis of samples with heterogeneous structures. In such techniques, an optical microscope is used to capture an image of the sample based on contrast due to absorption, scattering, or diffraction of visible light. Spectroscopic measurements of microscopic regions of a sample provides information about the spatial distribution of molecules in the sample.
For example, one of the earliest reports on microspectroscopy is the cytological study by the Swedish scientist T. Caspersson in the 1930s. The cytogenetic achievements of microspectroscopy include the identification of DNA as a macromolecule and chromosome staining, called “G banding”.
Many traditional spectroscopies have been adapted to microspectroscopy. Techniques widely used in microspectroscopy of samples are ultraviolet-visible absorption, fluorescence, Raman scattering and infrared absorption. The ultraviolet-visible absorption method measures absorbance of a sample and is suitable for obtaining a color spectrum in the visible region.
In the fluorescent probe method, light emission by fluorescent molecules under excitation light is measured. This method may require fluorescence staining of the sample. Infrared absorption by a sample is measured using infrared absorption based on molecular vibrations, which are unique to every compound.
Raman scattering measures molecular vibrations similar to infrared but using lasers in the visible and near-infrared regions. A Raman scattering microscope has high spatial resolution but the signal intensity is low, so that measurements can require a long time. Although an infrared absorption microscope has high sensitivity, it is difficult to obtain high spatial resolution. Raman and infrared are considered complimentary techniques.
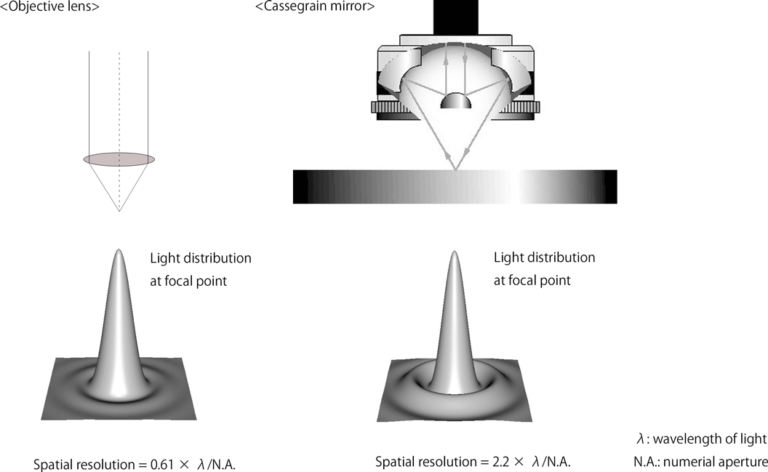
There are two types of objective optics for microspectroscopy: visible objective lenses and Cassegrain mirrors, and the type used depends on the purpose (Figure 1). For UV-Vis, fluorescence, and Raman objectives found in common microscopes may be used. For FTIR Cassegrain objectives are required.
Spatial resolution is important to microspectroscopy since it determines how small of features you can see. In the case of an objective lens, the spatial resolution is 0.61 × λ/N.A., and for a Cassegrain mirror, it is 2.2 × λ/N.A., where N.A. is the numerical aperture and λ is the wavelength of light. Thus, the spatial resolution is theoretically higher for an objective lens. Spatial resolution also increases with decreasing wavelength.
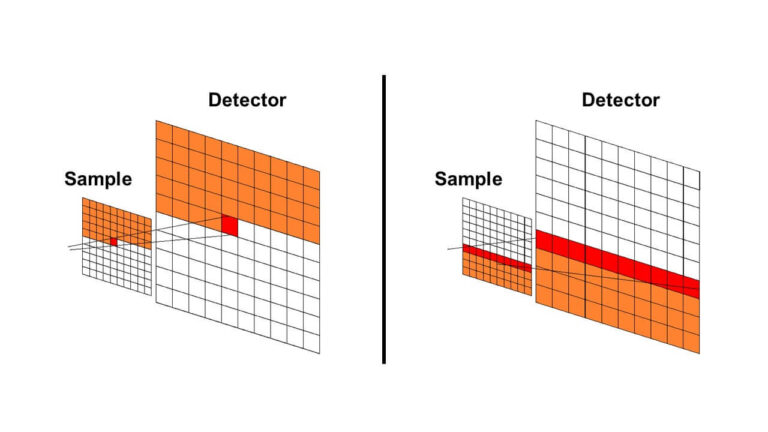
Creating a spectroscopic image of a sample may be done by either mapping or imaging a sample. First, a visual image of the sample must be obtained. In recent microspectroscopy systems, visual CCD imaging is performed instead of visual observation with an eyepiece.
The magnification of the image is determined by the objective lens, and the sample position is adjusted by an XY stage to set the field of view. Mapping is performed by automatically scanning a target area in the visual image and performing measurements at multiple points. These points form individual pixels in a spectroscopic image. Imaging can also be performed by simultaneously measuring multiple points using a linear array CCD detector for UV-Vis, fluorescence, and Raman and a linear array MCT for FTIR (Figure 2).
The spectroscopic image can be formed based on selecting a desired wavelength and examining the intensity of the peak at the points on the image.
Figure 3 is an example comparing infrared and Raman imaging results. It shows optical, infrared, and Raman images of a cross section of a multilayer-film sample.
Additionally, infrared and Raman principal component analysis spectra can be calculated by multivariate curve resolution (MCR) analysis. From the chemical images and the principal component analysis spectra, the distribution of polypropylene (PP), polyethylene (PE), and polyethylene terephthalate (PET) can be visualized. Some of the components appear in only either Raman or infrared.
Cellulose, which is a highly infrared-active molecule, was detected only by infrared microscopy. Since cellulose was not deliberately included in this film, it can be assumed that it is a contaminant. Titanium oxide (TiO2) was detected only by Raman microscopy as an ultrathin layer with a thickness of several micrometers.
Thus, complementary information can be obtained by combining the two spectroscopic measurement methods.
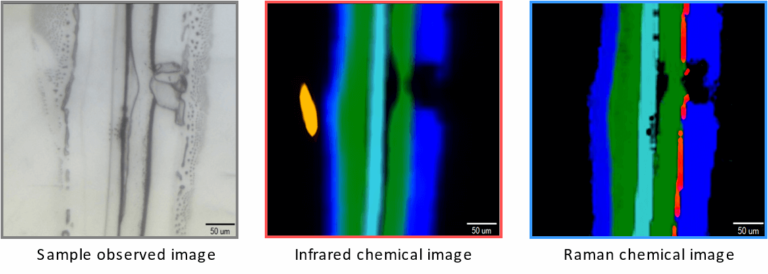
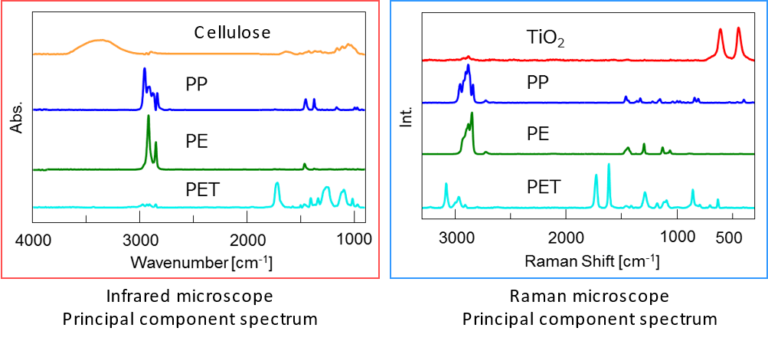
Figure 3 – Comparison of infrared and Raman imaging results
Via Luigi Cadorna 1
23894 Cremella (LC)
Italy
Tel. +39 039 9215811
Fax +39 039 9215835
e-mail jasco@jasco-europe.com
©Jasco Europe S.R.L. (Socio Unico) Direzione e coordinamento ex. art. 2497 bis c.c. – P.I. 08609570158 | Privacy Policy | Cookie Policy | Manage consent | Realizzazione sito web: Alkimedia
| Cookie | Duration | Description |
|---|---|---|
| cookielawinfo-checbox-analytics | 11 months | This cookie is set by GDPR Cookie Consent plugin. The cookie is used to store the user consent for the cookies in the category "Analytics". |
| cookielawinfo-checkbox-necessary | 11 months | This cookie is set by GDPR Cookie Consent plugin. The cookies is used to store the user consent for the cookies in the category "Necessary". |
| CookieLawInfoConsent | 1 year | Records the default button state of the corresponding category & the status of CCPA. It works only in coordination with the primary cookie. |
| elementor | never | This cookie is used by the website's WordPress theme. It allows the website owner to implement or change the website's content in real-time. |
| viewed_cookie_policy | 11 months | The cookie is set by the GDPR Cookie Consent plugin and is used to store whether or not user has consented to the use of cookies. It does not store any personal data. |
| Cookie | Duration | Description |
|---|---|---|
| Google Maps | Google Maps is a map visualization service managed by Google Inc. and is used to integrate such contents within its pages. |